
Despite the country’s economic ascendancy, China’s closed capital account and the difficulties of accessing its financial markets had historically constrained foreign investment into the nation’s bond and equity markets. The subsequent financial liberalization efforts China has undergone are paying off, leading to rapidly increasing weights for CGBs in the key benchmark indices and accompanying inflows.
A truly epochal event is well underway in capital markets: the integration of China government bonds (CGB) into the investment mainstream. Despite the country’s economic ascendancy, China’s closed capital account and the difficulties of accessing its financial markets had historically constrained foreign investment into the nation’s bond and equity markets. The subsequent financial liberalization efforts China has undergone are paying off, leading to rapidly increasing weights for CGBs in the key benchmark indices and accompanying inflows.
Specifically, CGBs now make up over 8% of the Bloomberg Global Aggregate Bond Index, after an inclusion process that ran from April 2019 to November 2020. Over the span of 2020, the level of CGBs in the JPMorgan GBI-EM Index reached 10%. A third active and passive flow opportunity is ongoing, as the FTSE World Government Bond Index started including CGBs on October 2021 and is expected to reach 5.6% by September 2024. We believe these changes are a hugely significant reconfiguration of the world’s major fixed income benchmarks.
China’s total bond market is the world’s second largest, and its government bond market is the third largest globally, commanding more capital than that of Germany, France, and Spain combined1. Given the prominence of these bond benchmarks in many investors’ portfolios, passive and active investors alike will be expressing views on China bonds, intentionally or not.
Impact on risk-taking budgets
While the benchmarks have changed rapidly, active investor portfolios have changed more slowly, or not at all. For example, many active managers had simply accepted the tracking error to the Bloomberg Global Aggregate Bond Index that comes with owning 0% China bonds. The operational difficulty of buying China bonds directly likely contributed to this inertia. However, as the proportion of China bonds in that index grew from about 2% at that time to over 8% now, the magnitude of the active decision to not own Chinese bonds grew as well.
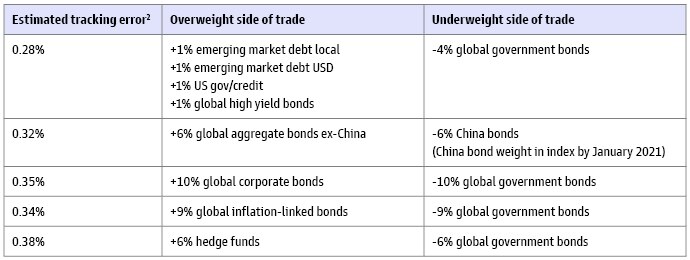
Tracking error, the standard deviation of the excess return of a portfolio to its benchmark, quantifies that magnitude. We estimate that owning 0% Chinese bonds, which we assume as equivalent to a conservative 6% underweight to Chinese government bonds, would drive a 0.32% tracking error. This single decision consumes 20% of the total active risk that a typical active core bond manager is granted to allocate. Translating tracking error into a range of outcomes, we might expect 68% of the deviations from the benchmark due to this underweight to fall within +/- 0.32%, and 95% of deviations to fall within twice that range, or +/- 0.64%1. Government fixed income is a space in which excellence and rankings may be decided by basis points, so this magnitude of deviation from the benchmark is meaningful. The table shows other trades that drive similar amounts of tracking error, despite being larger or more complex.
For example, imagine a global aggregate portfolio manager implements the first trade in the table after forming fundamental views through thoughtful research. Such a combination of intentional investment views may drive a 0.28% tracking error - slightly less than the amount a 0% China bonds position drives, even though the China bond position may be driven more by inertia than by fundamentals.
How Risky is it to Ignore China Bonds in a Global Aggregate Bond Portfolio?
Source: Goldman Sachs Asset Management Strategic Advisory Solutions. The portfolio risk management process includes an effort to monitor and manage risk, but does not imply low risk. For illustrative purposes only. *Chinese government bond underweight using data from Bloomberg Global Aggregate Index and FTSE Goldman Sachs China Government Bond Index since inception of that index in Feb 2014 through April 2019 when the process of including Chinese government debt began, using daily data. Assumes weight for China bonds in index is around 6% which is a conservative figure for investors who track the Bloomberg Global Aggregate bond index but more reasonable for investors who track the FTSE World Government Bond Index. Other trades using monthly data since 2002 due to longer index availability.
We believe China bonds’ significant impact on active risk-taking highlights the necessity for portfolio managers and CIOs to find an implementation option for China bonds, lest they dilute their ability to express active views or even break out of their tracking error bands. Portfolio managers can buy China bonds directly via Bond Connect, or they can use a China bond pooled vehicle The direct route requires a lengthy account-opening process, onshore custodian costs, legal costs, and compliance costs for each and every vehicle or account managed.
Similarly, if you are a fund selector, have you asked your asset manager “what’s your view on China bonds, as it is a significant driver of active risk and return?” From discussion with many portfolio managers, they usually have an investment basis for going 10% overweight corporates, and in our view they should have an investment basis for going 6% underweight China bonds.
We believe a 0% allocation to China bonds in a core bond allocation is analogous to a 0% allocation to UK equities in a global developed equity allocation, as they are both about 6% of the benchmark index. 0% is as bearish as a long-only manager can be on China, and such a position is likely to be interpreted as an intentional investment view because widely-available ETF implementations exist for China bonds.
A Macro Perspective
A look at China’s economic heft puts context around how index committees and investors alike get comfortable with the idea of owning meaningful Chinese exposures via index inclusion. China contributed 29%3 of global GDP growth on a purchasing power parity basis in 2019, as much as all developed nations. Since, China has recovered to pre-COVID levels of GDP notably rapidly. Asia’s contribution to global GDP on a PPP basis crossed 50% in 20204. Statistics like these reinforce the impression of the global financial center of gravity moving eastward.
Another group taking notice of China’s increased international flows and influence are reserve mangers. China has the third largest weight in the International Monetary Fund’s (IMF’s) special drawing rights (SDR) basket at 10.9%, second to the USD at 41.7% and the Euro at 30.9%. This basket of major currencies, USD, EUR, JPY, GBP, and CNY acts as a stable asset in countries’ international reserves and is an accounting unit for IMF transactions with member countries. The disparity between China’s weight in the SDR basket and the current weight of CNY in official foreign exchange reserves leads to the possibility of significant future growth in demand.
China in a Multi-Asset Portfolio
Due to index inclusion, portfolios ranging from basic to diversified have significant exposure to Chinese bonds and equities, a marked increase from 2019 pre-inclusion. For example, a basic balanced portfolio with 50% global aggregate fixed income has as of March 2022 around 4% of China bonds from global aggregate- benchmarked assets. If an investor held 9% emerging market equities, they would already own about 3% China equities5.
CGBs diversify global aggregate bonds and Chinese equities, as seen by their close to 0 correlations6 of 0.15 and -0.24, respectively. Within global government bond markets, China exhibits low correlations ranging from [0.10;0.25] with the US, UK, Germany, and Japan.
Nearly all investment grade government bond real yields are below 0%, with 33 out of 41 investment-grade countries having negative real 10-year sovereign bond yields7. Compared to these other major economies, Chinese real yields are highly attractive, and the few countries with higher real yields have weaker credit ratings. At A1, China sits in the middle of the investment grade spectrum.
CGBs also have a lower realized volatility (in local currency) than US Treasuries or UK Gilts. The fact that foreign ownership while increasing was still low over the period studied (Dec-2016 to Dec-2021) may bias that realized volatility figure downward. Additionally, domestic Chinese investors tend to buy government bonds and hold them to maturity, which leads both to lower liquidity on the secondary market and perhaps fewer buying/selling reactions around major market events. However, there is reason to be optimistic given CGBs have been resilient and delivered attractive performances during both the Evergrande crisis in 2021 and the Russia’s invasion of Ukraine in 2022.
These allocations are strategic, or long-term in nature. They do not show additional capital that may be deployed according to shorter-term China views, such as the view that the passive flows into CGBs could be supportive for both the bonds and the currency. Today, the passive flows opportunity in the FTSE World Government Bond Index is still yet to unfold fully, with an estimated $130bn of flows expected by late 20248.
The inclusion of CGBs in major bond indices underscore China’s importance on the global economic stage. Are your portfolios ready for this update?