
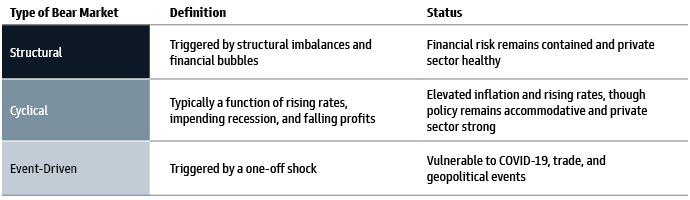
This year has seen no shortage of market swings, with the S&P 500 down over -20% year-to-date. However, given the absence of structural imbalances, we believe current market volatility is more in line with a cyclical bear market than a potentially deeper and longer structural bear market. We explore the differences between each of the three bear markets—structural, cyclical, and event-driven—and introduce important factors when identifying market bottoms. We distinguish between bear market rallies, as we experienced this summer, and the start of a new bull market. As such, we believe that not all bear markets are created equally (Exhibit 1), and that understanding the current bear market can inform the timing and magnitude of the recovery.
Exhibit 1: No Clean Fit
Source: Goldman Sachs Global Investment Research and Goldman Sachs Asset Management. As of October 14, 2022. “Drawdown” refers to the peak-to-trough price return of the S&P 500. Average length and average drawdown figures are based on US bear markets since 1835. Past performance does not guarantee future results, which may vary. Please see additional disclosures at the end of this page.
- Structural bear markets have the deepest, most prolonged declines, averaging around -60% over the course of three years and taking up to a decade to fully recover. What distinguishes a structural bear market from a cyclical one is the presence of meaningful financial imbalances, which we do not see as a risk today. In most structural bear markets, private-sector leverage is extremely elevated, whereas today we observe healthy balance sheets in the private sector.
- Cyclical bear markets tend to fall about -30% at their maximum drawdown and last an average of two years, taking about five years to fully recover. These tend to be associated with the economic cycle and monetary policy tightening.
- Event-driven bear markets are the shortest in duration and are typically triggered by an exogenous shock, such as the onset of the COVID-19 pandemic. An average decline for event-driven bear markets is about -30%, and we typically do not see a prolonged recession as a result.
Exhibit 2: Depth, Length, and Recovery
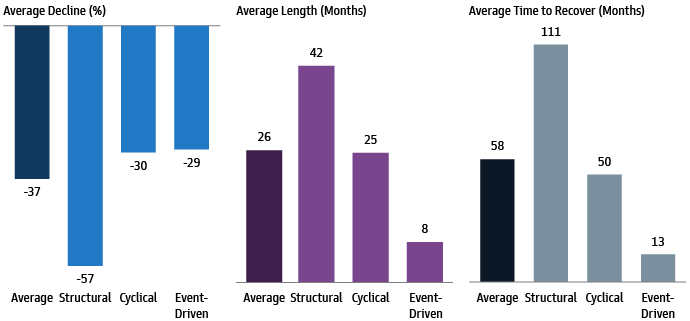
Source: Goldman Sachs Global Investment Research. Chart shows US bear markets and recoveries since the 1800s. As of September 7, 2022. For illustrative purposes only.
In the bear market rally this past summer, markets reflected growing confidence that inflation and interest rates were peaking. History suggests that when the Federal Reserve (Fed) is the cause of a correction, it is often also the cure that enables the recovery. With the expectation that the Fed continues to hike rates through early 2023, we do not think a genuine bear market trough has been reached because we believe: 1) core inflation and rates have not come down convincingly, 2) economic growth will likely continue to weaken, and 3) valuation and investor positioning have not yet reflected market capitulation. Volatility around market troughs is often a result of investor perception shifting between a soft landing, which is likely to end around a peak in policy, and a hard landing, which requires lower valuations and economic growth bottoming.
To be sure, the Fed’s policy path and questions regarding a peak in inflation and rates remain uncertain. As such, we may see more episodic volatility in the near-term. We believe that ultimately, the strength of the private sector and the absence of structural sources of weakness in the economy mean that this bear market may not see the worst second-or-third order effects traditionally associated with structural bear markets. Long-term investors may be best positioned to stay the course, with a recovery likely, yet tough to time.